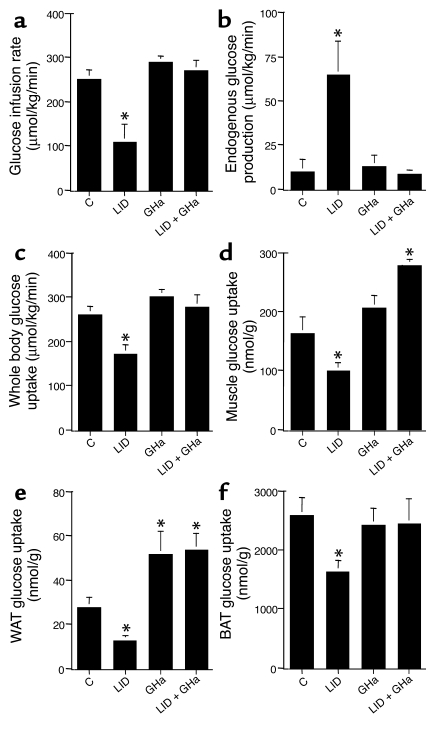
Figure 3.
Various metabolic parameters during hyperinsulinemic-euglycemic clamp of control, LID, GHa, and LID + GHa mice. (a) Average glucose infusion rates were measured during 90–120 minutes of the hyperinsulinemic-euglycemic clamp. (b) Insulin-stimulated hepatic glucose production during the hyperinsulinemic-euglycemic clamp. (c) Insulin-stimulated whole-body glucose uptake. (d) Insulin-stimulated muscle (gastrocnemius) glucose uptake. (e) Insulin-stimulated WAT glucose uptake. (f) Insulin-stimulated BAT glucose uptake. Data are expressed as average ± SE for n = 6 animals per group. (*P < 0.05 compared with control.)

