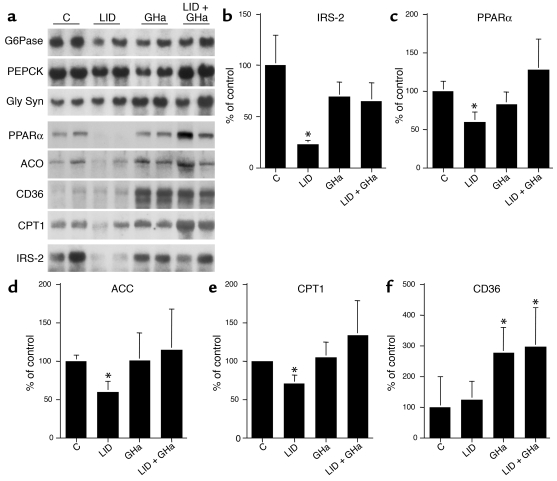
Figure 6.
Analysis of mRNA levels of various genes related to glucose metabolism, lipid metabolism, and insulin signaling in livers of control, LID, GHa, and LID + GHa mice (5–6 mice per group). (a) Northern blots were used to measure G6Pase, PEPCK, glycogen synthase (Gly Syn), PPARα, ACO, CD36, CPTI, and IRS-2 mRNA levels. Average values for the mRNA levels of IRS-2 (b), PPARα (c), ACC (d), CPT1 (e), and CD36 (f) that differed between genotypes are shown in the graphs. Data are expressed as average ± SE for four animals per group, normalized to 18S RNA levels. (*P < 0.05 compared with control.)

