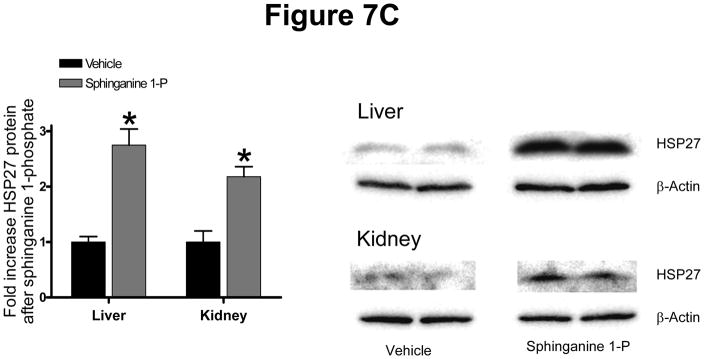
Figure 7.
(A) Representative gel images of RT-PCR results GAPDH and mouse HSP27 mRNAs extracted after treatment with vehicle (0.4% fatty acid free BSA) or 0.1 mg/kg sphinganine 1-phosphate i.v. 5 hrs prior. Densitometric quantification of relative mRNA band intensities normalized to GAPDH from RT-PCR reactions are shown in the bottom panel (N=6). Data are presented as means ± SEM. *P<0.05 vs. Vehicle group. (B) Representative immunoblots for phospho (p)- and total-ERK, phospho (p)-and total-Akt, phospho (p)- and total-HSP27 from renal cortices and liver of mice (right panel) after injection with vehicle or 0.1 mg/kg sphinganine 1-phosphate i.v. 15 min. prior. C) Representative immunoblots for total-HSP27 and actin (showing equal lane loading) from renal cortices and liver of mice after injection with vehicle or 0.1 mg/kg sphinganine 1-phosphate i.v. 24 hrs prior. Densitometric quantifications of relative band intensities are also shown (left panel, N=4). *P<0.05 vs vehicle. Error bars, 1 SEM.


