Fig. 2.
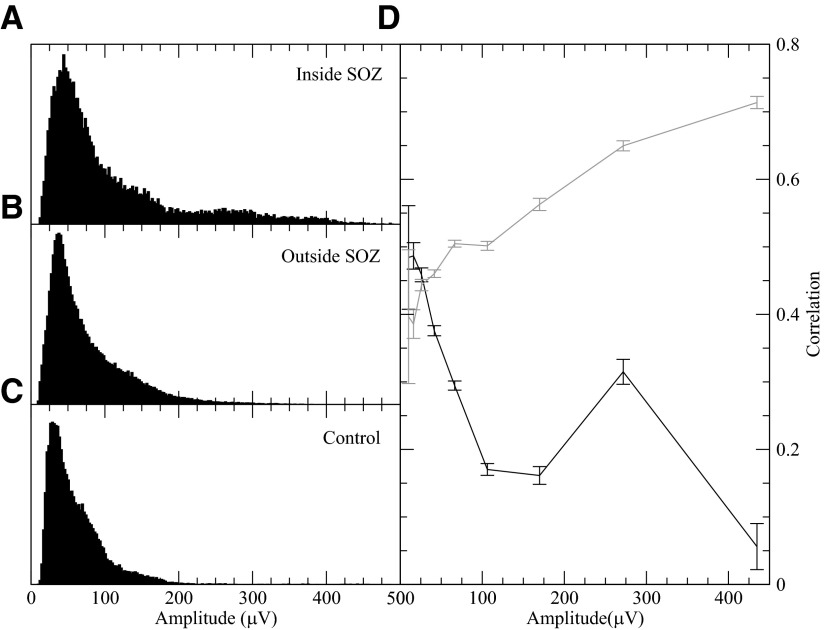
Distributions of the amplitude (root mean square) of the demeaned electroencephalographic (EEG) signals inside the seizure onset zone (SOZ) of epileptic brain (A), outside the SOZ (B), and in control patient brain (C). The median of the SOZ signal amplitude is significantly higher than control brain signal amplitude (P > 0.05). D: comparison of a SOZ electrode's average correlation with a neighbor inside the SOZ (gray) and a neighbor outside the SOZ (black) as a function of the SOZ electrode's amplitude. The correlations shown are averaged over all possible neighboring triplets (SOZ–SOZ–non-SOZ). Using a Mann-Whitney test, for all but the smallest amplitude bin, median differences were highly significant (P > 0.01). Confidence intervals are shown. For all these figures, the correlations and amplitudes of 1,200 windows (20 min) from each of the 4 patients with epilepsy were used. The higher value around amp = 275 μV for bridging pairs in D is largely due to patient 2, who had generally higher amplitude activity and a drop off in correlation at a higher amplitude.

