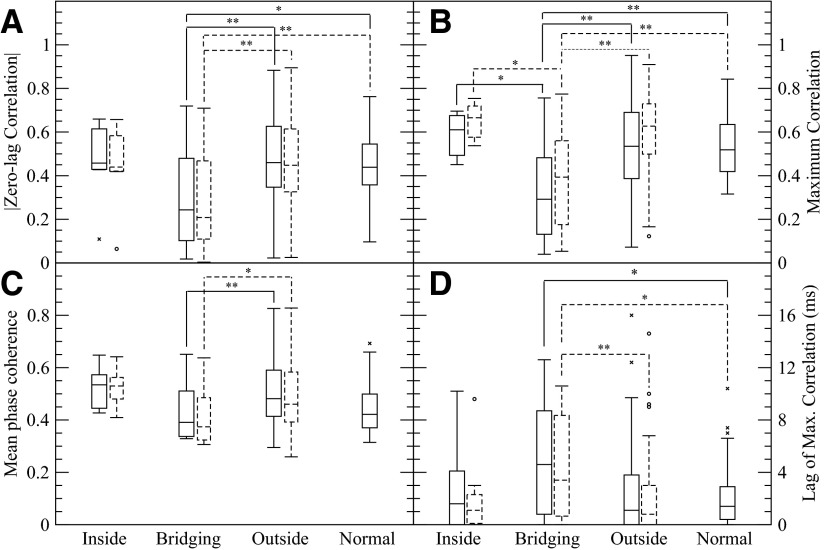
Fig. 5.
Comparison of different synchrony measures using zero-lag correlation, maximum correlation, and mean phase coherence (0.5–25 Hz band). A: the magnitude of zero-lag correlation, B: maximum correlation, C: mean phase coherence, and D: lag of max correlation. Both the entire data set (solid) and the data set with interictal spike time intervals removed (dashed) show similar results. The zero-lag correlation and maximum correlation for electrode pairs that bridge between SOZ and regions outside the SOZ is reduced compared with other electrode pairs in epileptic brain and electrode pairs in control brain. The MPC shows significantly lower synchrony for bridging electrode pairs in comparison to outside pairs. The time lag producing maximum correlation D is increased for bridging electrode pairs compared regions outside the SOZ in epileptic brain. Statistical comparisons of the data without epileptiform spikes to the control patient data were not made. To emphasize the body of the distribution, several outliers in the bridging pair distribution (lag = 140, 159, 208, 268, and 303 ms), the outside pair distribution (lag = 85, 131, 172, and 182 ms), and normal pair distribution (lag = 40 ms) are not shown. For the data with the interictal spikes removed, several outliers in the bridging pair distribution (lag = 146, 158, 162, 223, and 498 ms) and the outside pair distribution (lag = 79, 135, 179, and 291 ms) are similarly not shown. Brackets with * and ** indicate significantly different mean values at (P > 0.05) and (P > 0.01) with a Mann-Whitney rank sum test.

