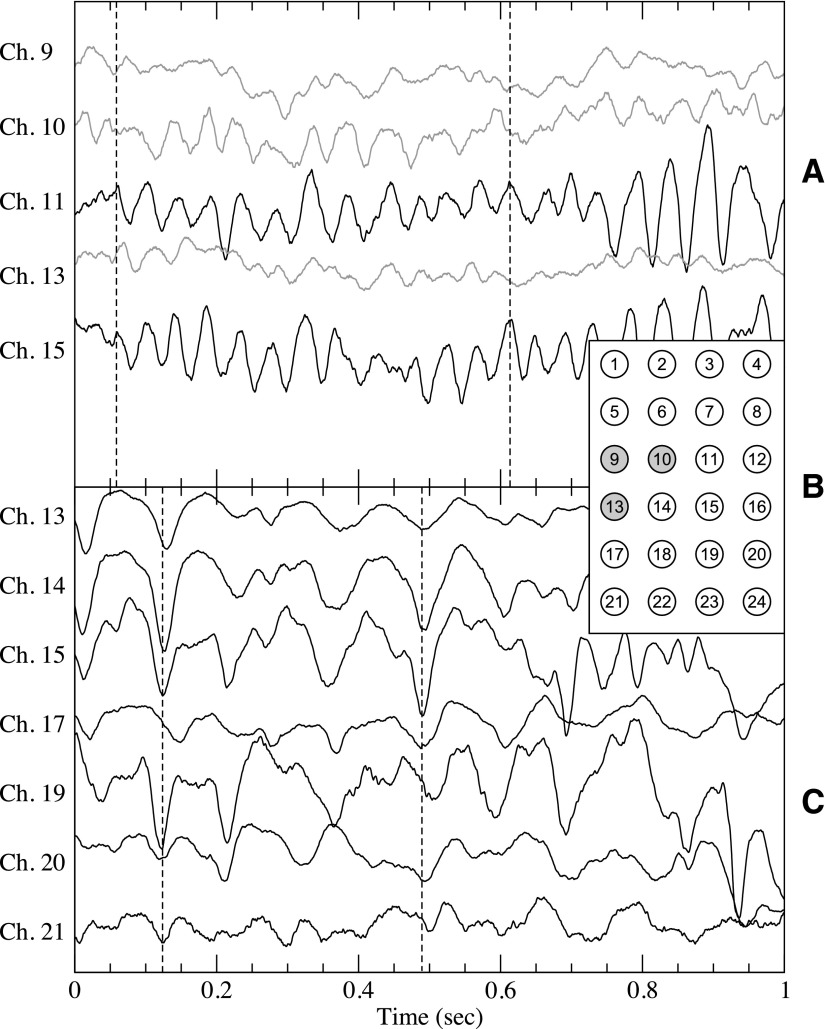
Fig. 6.
A: sample interictal intracranial electroencephalographic signals from patient 1 with epilepsy from both inside the SOZ, shown in gray, and near signals outside the SOZ (black). Dashed line, significant phase lag between inside and outside the SOZ. B: spatial layout of the intracranial electrodes for patients 1 and A with the SOZ electrodes (9, 10 and 13) of patient 1 shown in gray. C: sample signals from the control patient A. The spatial numbering is as shown in B. For clarification, signals are offset vertically.

