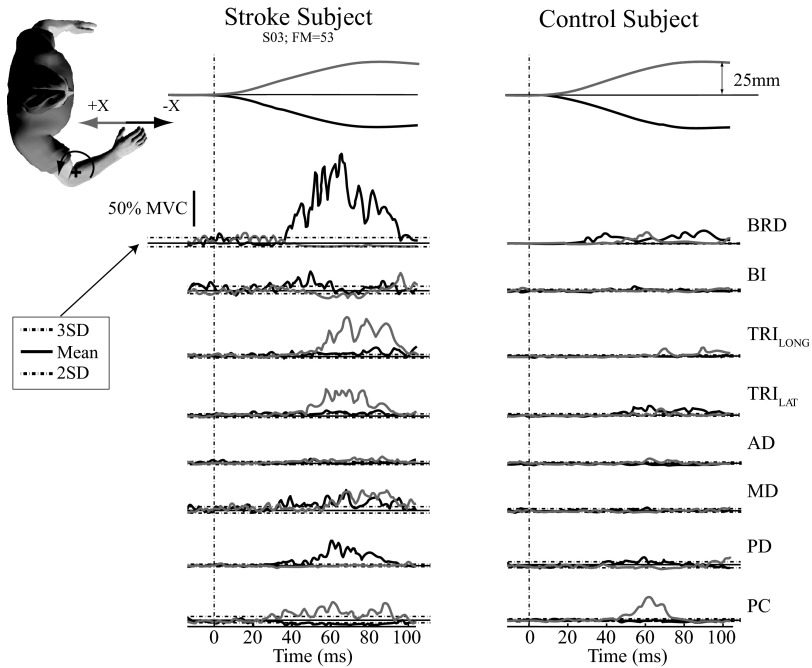
Fig. 3.
Typical maximum voluntary contraction (MVC)–normalized stretch reflex EMG responses. Stretch reflex EMG responses from a representative stroke subject (S03) having an FM score of 53 (left column) and an age-matched control subject (right column). Each was exerting a voluntary force of 5 N directed toward the glenohumeral joint (elbow flexion moment). EMGs are normalized to percentage of maximum voluntary contraction (%MVC). Thin and thick lines correspond to average reflex responses during positive and negative perturbations along the X-axis, respectively. The dashed vertical line corresponds to the perturbation onset. The thick horizontal lines correspond to average background EMG and dashed horizontal lines correspond to 3SDs above average background EMG and 2SDs below average background EMG.

