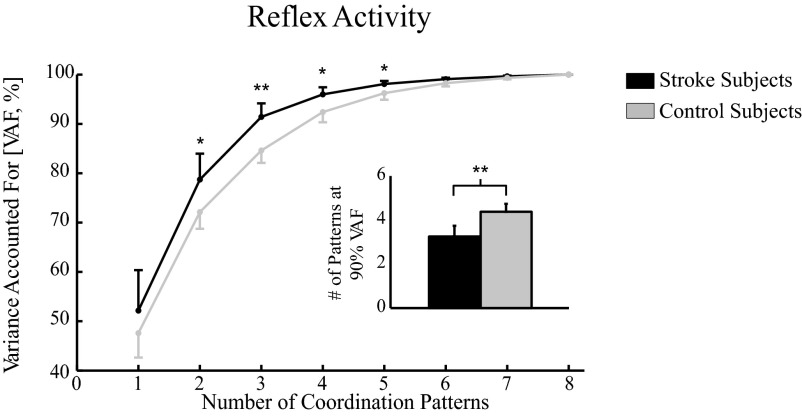
Fig. 5.
Comparing number of reflex coordination patterns between the stroke and control groups. Coordination patterns were estimated using independent component analysis/principal component analysis (ICA/PCA) on the entire set of reflex EMG data for stroke and control subjects. Bar graphs depict the total number of coordination patterns necessary to explain roughly 90% of EMG data variance accounted for (VAF). Average reflex EMGs from 20 to 100 ms following perturbation onset were included in this analysis; data within each 10-ms bin were averaged prior to processing.

