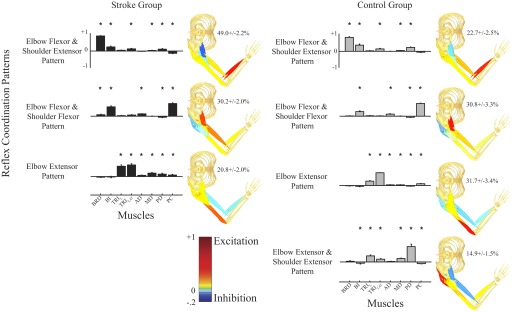
Fig. 6.

Summary of reflex coordination patterns for the stroke and control groups. Patterns on the left column describe reflex data collected from stroke subjects and those on the right column describe reflex data from the control subjects. Muscles in each coordination pattern are indicated at the bottom of each column. Bar heights in each pattern correspond to the relative reflex activation magnitudes in each muscle normalized to unity. Percentages on the right of each pattern indicate the relative variance described by that pattern; only data remaining after the initial PCA reduction are considered in the relative variance calculation. Statistical significance corresponds to values significantly different from chance (*P < 0.05).
