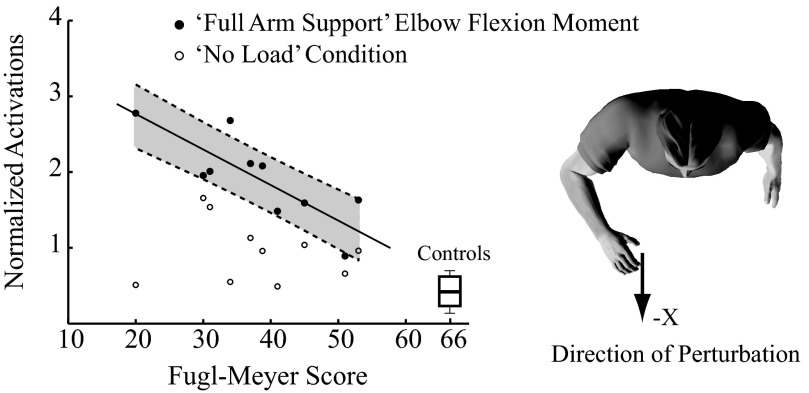
Fig. 8.
Task-specific activation patterns vs. motor impairment level for the flexor coordination pattern. Normalized activations of the flexor pattern were plotted against FM scores during the “no load” condition when subjects were relaxed (open circles) and during voluntary elbow flexion (solid circles). For both conditions, the robot generated displacement perturbations in the −X direction, which produced the greatest responses in both groups. Shaded region in gray depicts the 95% CI of the linear model for the elbow “pull” condition. Boxplot represents the quartile range of normalized activations in the control subjects with designated maximum FM scores of 66. The black star indicates a significant regression (r2 = 0.63, P = 0.03) of elbow flexor torque on FM score.

