Fig. 1.
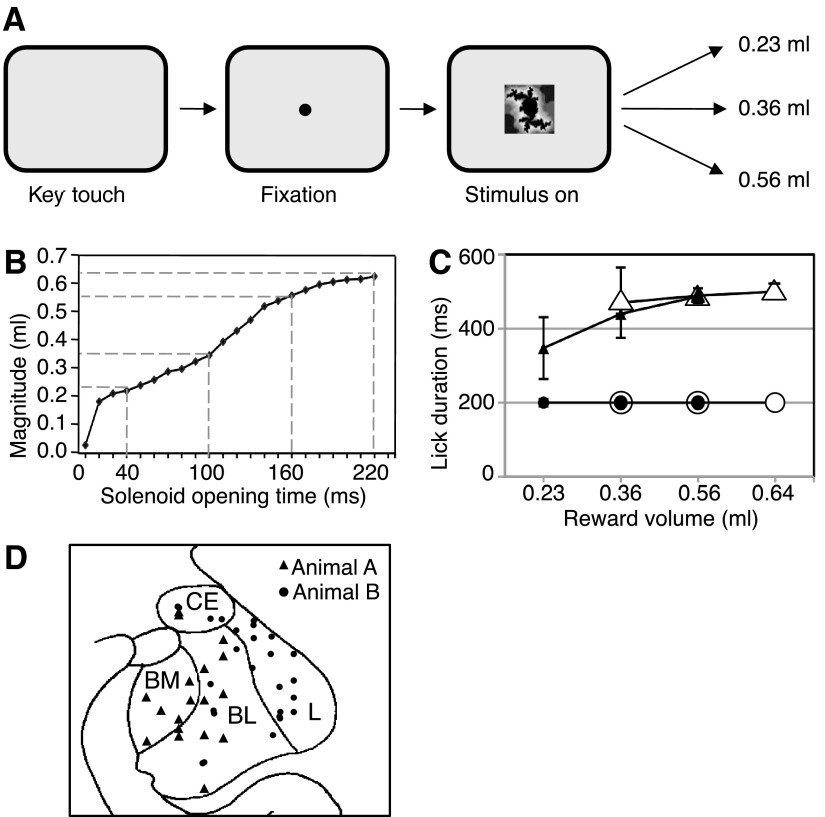
Task, licking, and recording sites. A: sequence of task events in the main experiment. The single stimulus predicted low, intermediate, or high magnitude of liquid reward with equal probability (P = 1/3) drawn semirandomly from distribution A. B: calibration of liquid reward magnitude as a function of solenoid valve opening time. The dashed lines indicate 4 typical values used for distributions A (main experiment) and B (additional for adaptation test). C: median lick durations during stimulus (●) and after reward onset (▴) for main distribution A (195 trials from 12 trial blocks). ○ and ▵, licking with the additional distribution B (adaptation test). The 95% CIs were (from left to right): stimulus A, 0.3, 0.1, and 0.1 (too small for error bars); stimulus B, 0.25, 0.25, and 0.1; rewards A, 83.3 (error bar), 0.4, and 0.5; rewards B, 95.4, 20.1, and 19.0. Trials were grouped according to the 2 distributions and the actual reward delivered (abscissa). D: histological reconstruction of recording sites in the amygdala for magnitude coding neurons in animal A, with approximate positions for animal B superimposed (total n = 56 neurons). CE, central nucleus; L, lateral nucleus; BL, basolateral nucleus; BM, basomedial nucleus.

