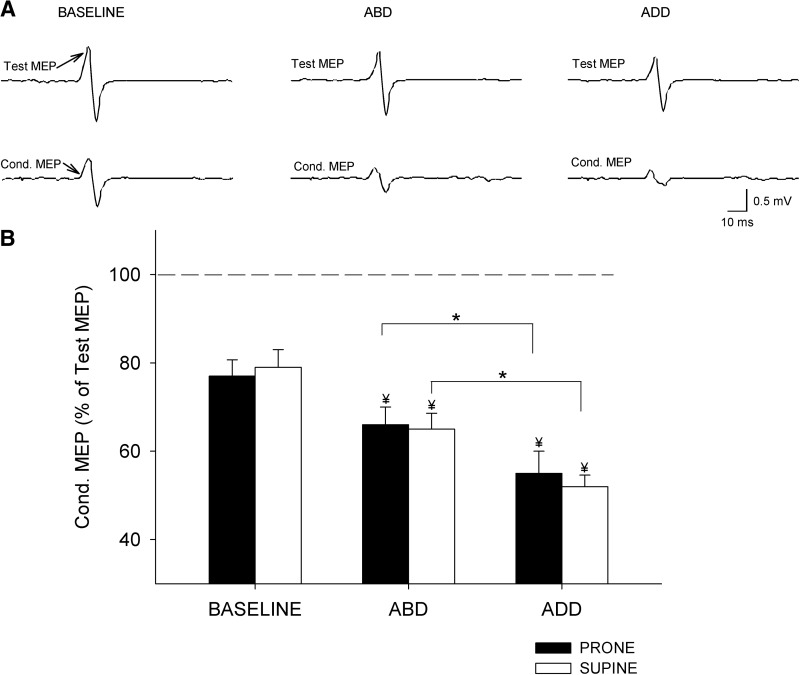
Fig. 3.
Interhemispheric inhibition (IHI). A: IHI recorded from the left FDI of a representative subject during 10% of left ABD, whereas the right index finger remained at rest (baseline) or performed 30% of ABD or ADD. The actions by the right index finger are indicated as Baseline, ABD, and ADD. In this example the right hand was positioned in prone posture. Test MEP and conditioned MEP (Cond. MEP) are indicated by arrows. B: group data (n = 12). The abscissa shows the conditions tested during the assessment of IHI contractions in prone (black bars) and supine (white bars) postures. The ordinate indicates the magnitude of the conditioned MEP expressed as a percentage of the Test MEP [(Conditioned MEP × 100)/(Test MEP)] during bilateral isometric forces. The horizontal dashed line represents the size of the Test MEP. Note that IHI was increased to a larger extent during ADD forces regardless of the right hand posture. Error bars indicate SEs. *P < 0.05. Also note that IHI was significantly increased with respect to the baseline in all conditions tested (¥ indicates significant difference with respect to baseline).

