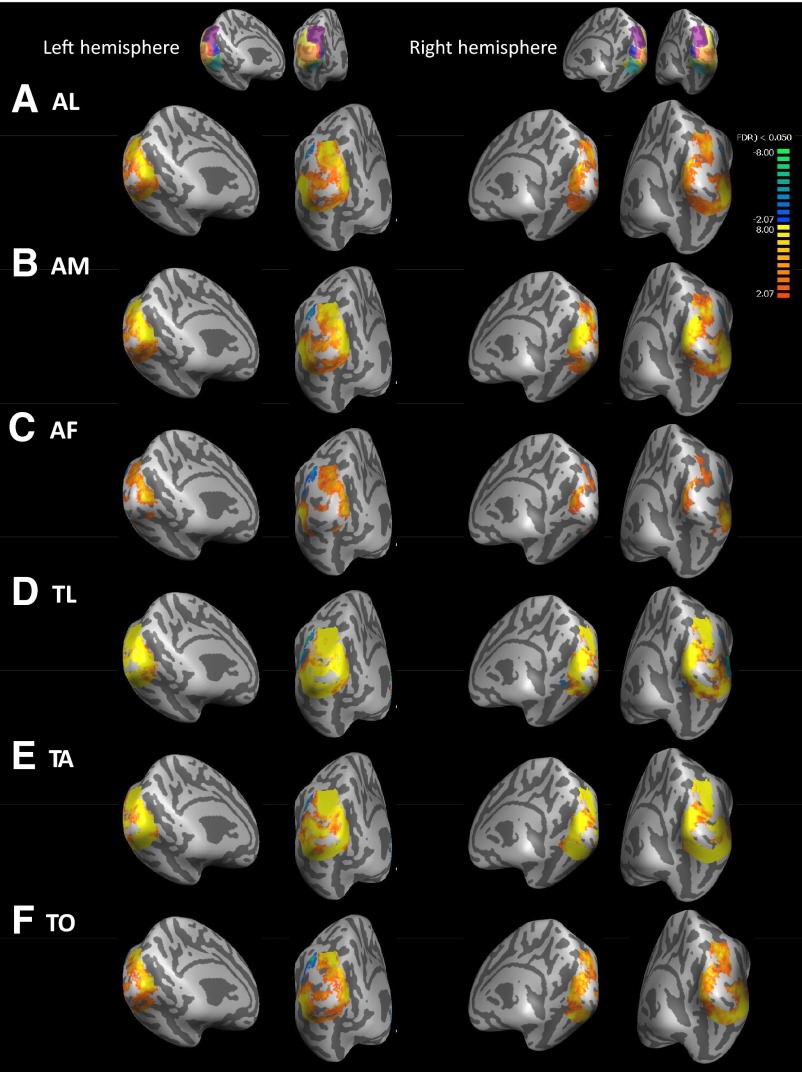
Fig. 5.
Blind BOLD responses for each cross-modal task vs. the key-press task. Medial views are presented on the left for each hemisphere, whereas views from behind the occipital pole are presented on the right for each hemisphere. LH, left hemisphere. RH, right hemisphere. Insets show the anatomically defined ROIs that were used to mask the data. Warm colors represent greater BOLD response in the auditory/tactile task than the key-press condition. Data are thresholded at q(FDR) <0.05. [Patterns of activation were similar in magnitude for much higher thresholds such as q(FDR) <0.003; data not shown.] A: auditory letters (AL) vs. key-press task. B: auditory motion (AM) vs. key-press task. C: auditory frequency (AF) vs. key-press task. D: tactile letters (TL) vs. key-press task. E: tactile animals (TA) vs. key-press task. F: tactile orientation (TO) vs. key-press task.

