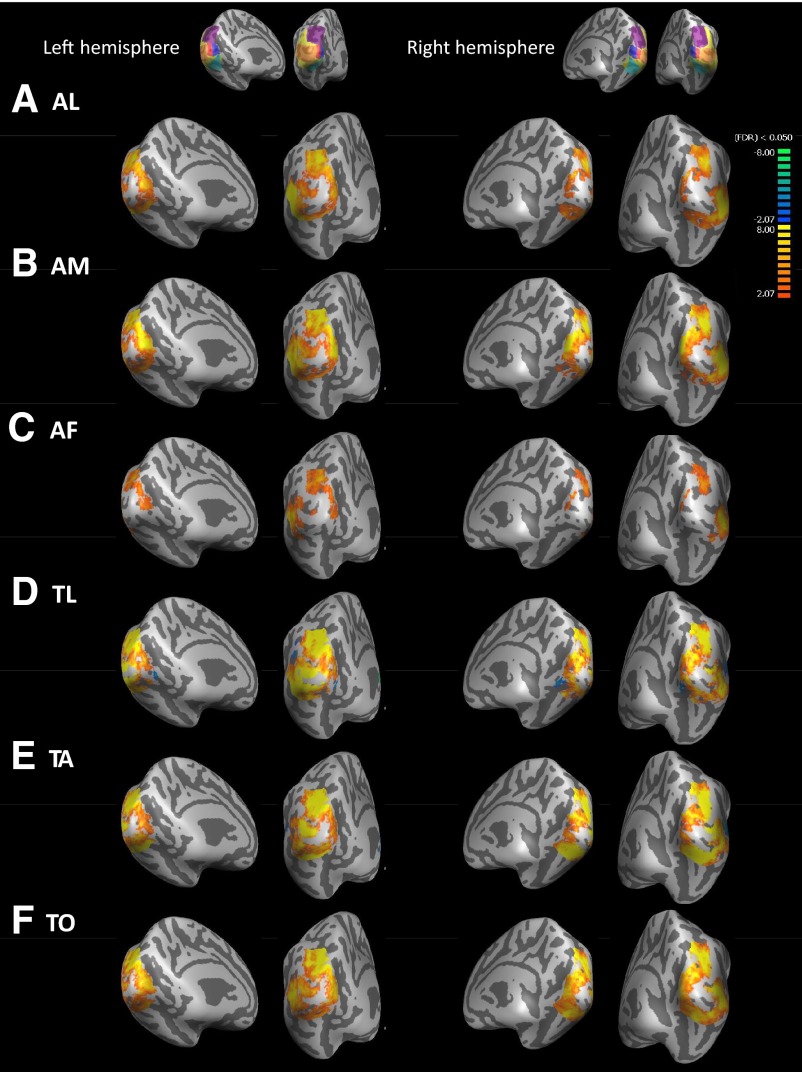
Fig. 6.
Blind–Sighted group averages of cross-modal BOLD response for each cross-modal task vs. the key-press task. Medial views are presented on the left for each hemisphere, whereas views from behind the occipital pole are presented on the right for each hemisphere. LH, left hemisphere; RH, right hemisphere. Insets show the anatomically defined ROIs that were used to mask the data. Warm colors represent greater BOLD response in blind than sighted subjects (cross-modal plasticity); cool colors represent greater BOLD response in sighted than blind subjects. Data are thresholded at q(FDR) <0.05. [Patterns of cross-modal activation were similar in magnitude for much stricter thresholds such as q(FDR) <0.003; data not shown.] A: auditory letters (AL) vs. key-press task. B: auditory motion (AM) vs. key-press task. C: auditory frequency (AF) vs. key-press task. D: tactile letters (TL) vs. key-press task. E: tactile animals (TA) vs. key-press task. F: tactile orientation (TO) vs. key-press task.

