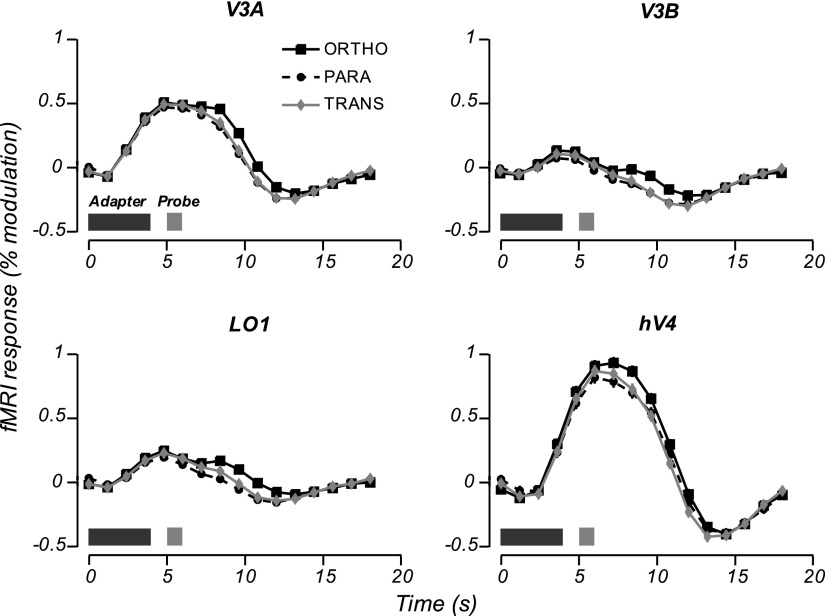
Fig. 2.
Event-related time courses (estimated by linear deconvolution and averaged across scanning sessions) for the 4 visual areas showing the greatest absolute difference in response amplitude between parallel and orthogonal probe stimuli. Dark and light bars in the bottom left corner of each panel indicate presentation of adapter and probe stimuli. Error bars (smaller than plot symbols) represent the SE for each time point (computed as the root mean square of the regression SEs across scanning sessions).

