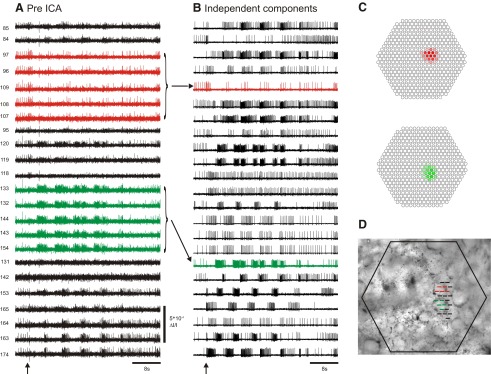
Fig. 2.

ICA extracts the spiking activity of individual neurons from mixed and redundant photodiode array optical recording data. A: pre-ICA; 23 traces of a 464 trace photodiode array recording of a 4 cycle swim motor program in the dorsal pedal ganglion of Tritonia, elicited by a stimulus to pedal nerve 3 (10 V, 5 ms pulses, 10 Hz, 1 s; arrow). Typical of such recordings, neurons large enough to be detected by many diodes are recorded redundantly (e.g., red and green traces), whereas many diodes detect signals from more than one neuron, resulting in signal mixtures. Traces were filtered in Neuroplex with a Butterworth band-pass filter (between 5 and 100 Hz). Diode numbers are shown to the left of the diode traces here and in subsequent figures. B: post-ICA; 23 of the 88 neuronal independent components returned by ICA containing recognizable neural activity are shown. The independent components shown in red and green illustrate how redundancy in the optical recordings is eliminated by ICA (see arrows). C: displaying the contribution of each diode to any given component (obtained from the inverse of the ICA weight matrix) indicates the location of the component, and therefore the corresponding neuron, on the photodiode array. The diode maps for the red and green components shown in B are displayed. D: the array locations of all 23 traces shown in A are superimposed at their recording site on the pedal ganglion.
