Fig. 2.
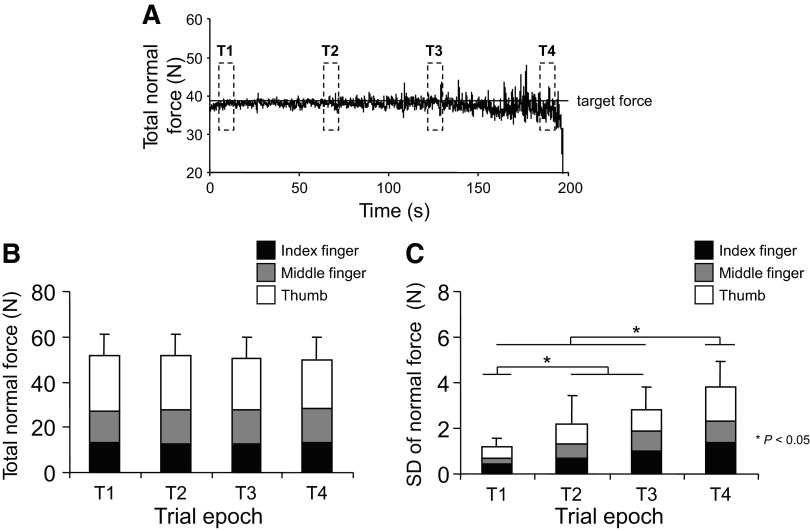
Digit forces and force variability. A: the time course of total normal force during the fatiguing contraction trial from 1 representative subject. —, the target force equivalent to 40% of the total normal force measured during the maximal voluntary contraction (MVC) trial characterized by the largest force. - - -, the epochs used for analyses of digit forces and electromyographic (EMG) amplitude. This subject was able to maintain a constant total normal force for ∼190 s after which task failure occurred (see text for details). B and C: the magnitude of total and individual digit normal forces and the SD of total normal force, respectively, measured at each time epoch. Data in B and C are averages of all subjects (±SE).

