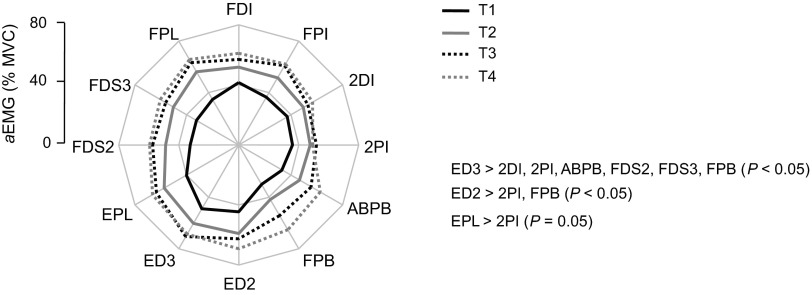
Fig. 4.
EMG amplitude (aEMG) as a function of time epoch and muscle. The EMG amplitude from each muscle is shown as percentage of EMG recorded during MVC (aEMG) for each time epoch during the fatiguing contraction trial. Significant differences in EMG amplitude among muscles are indicated on the right side of the plot. Data are averages of all subjects.

