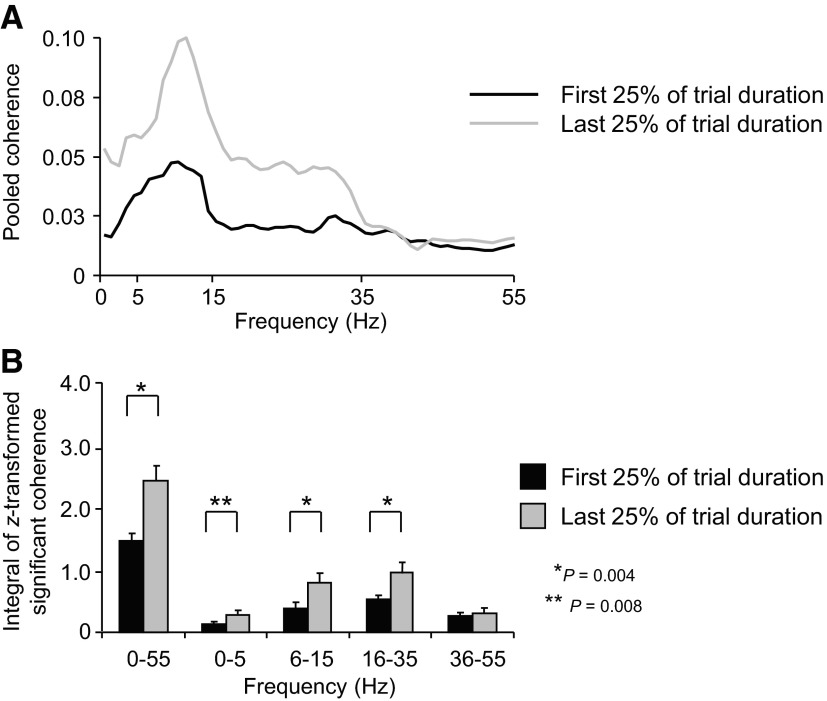
Fig. 6.
EMG-EMG pooled coherence across all muscle pairs. A: EMG-EMG pooled coherence computed across all muscle pairs (n = 66) for the 1st and last 25% of the fatiguing trial (black and gray traces, respectively) and averaged across subjects. B: the integral of the z-transformed significant coherence computed for the 1st and last 25% of the fatiguing trial within the 0–55 Hz frequency range and within 0–5, 6–15, 16–35, and 36–55 Hz pooled across all muscles. Data in B are averages of all subjects (±SE).

