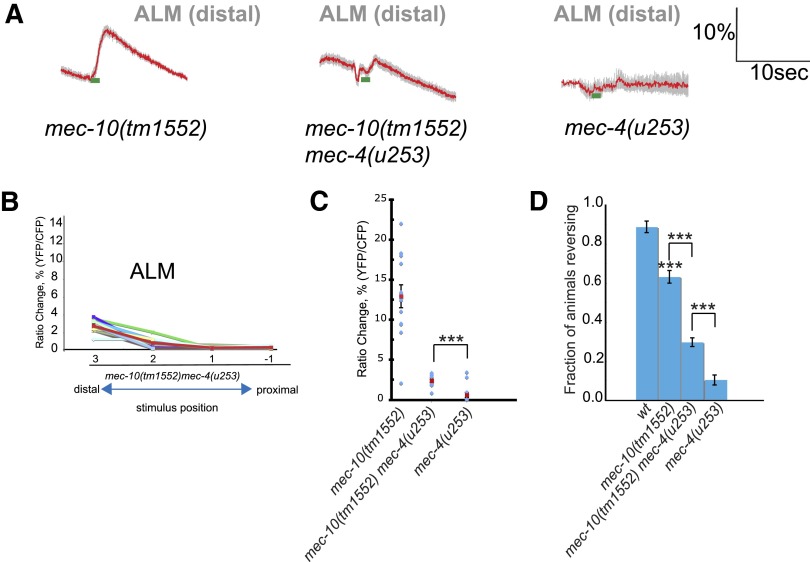
Fig. 5.
Touch phenotype of mec-10 mec-4 double mutants. A: averaged calcium responses of mec-10(tm1552), mec-10(tm1552) mec-4(u253), and mec-4(u253) animals to stimulation of the ALM distal dendrite. Animals were stimulated at position 3 as described in Figs. 2 and 4. Each trace represents the average percentage change in R/R0, where R is the fluorescence emission ratio at a given time point and R0 is its initial value. In all, 13 animals were imaged for each genotype. B: avoidance behavior in response to gentle anterior touch. Animals were touched with an eyelash at the indicated positions; escape responses (reversals) were scored as described. Over 200 animals were tested for each genotype; statistical significance (P < 0.0005) is according to the Student's t-test. C: scatterplot of peak calcium responses for mec-10(tm1552) mec-4(u253) animals with different stimulus positions. Red lines indicate the mean response at each of the 4 stimulus points (see Figs. 2 and 4); error bars indicate SE. Every other line indicates the response for a single animal. Half the animals were stimulated from anterior to posterior and half from posterior to anterior. D: scatterplot of peak calcium responses for distal stimulation of each genotype. Each point indicates peak calcium response for stimulation at position 3 as in A. The double mutant showed significantly more response than mec-4 (u253) according to the Mann–Whitney rank-sum test (***P < 0.0005).

