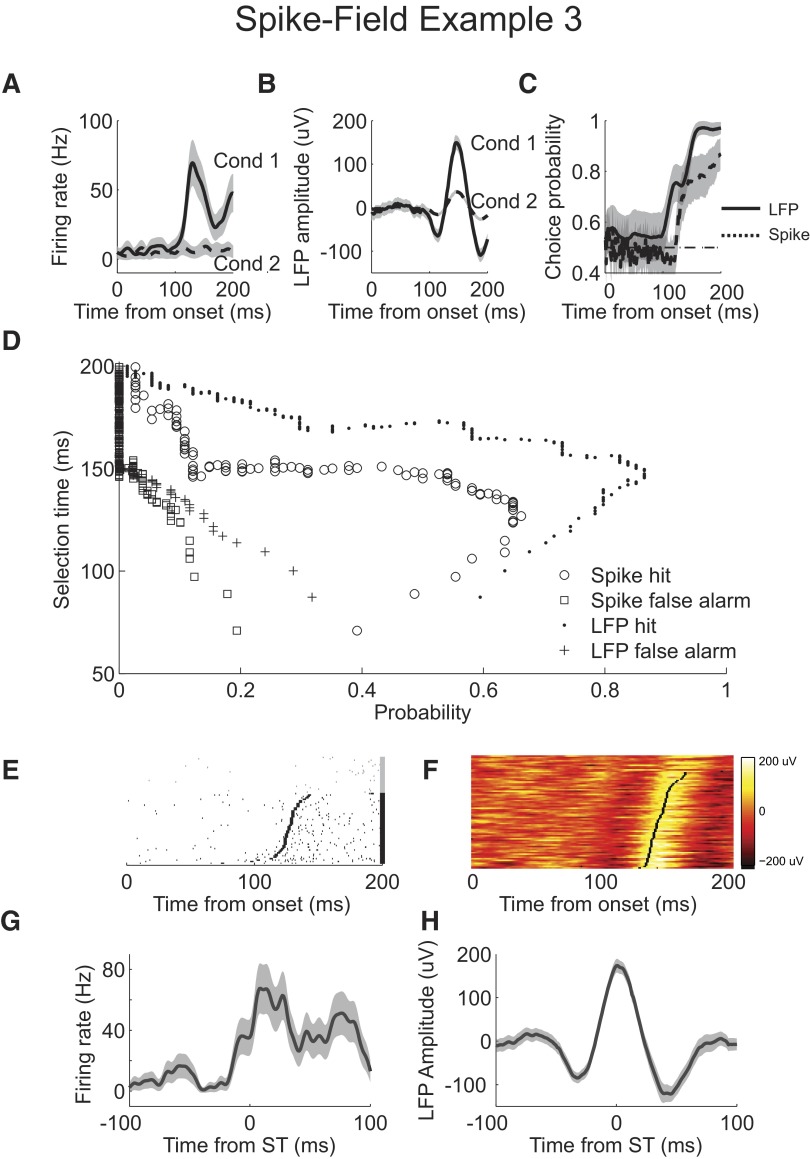
Fig. 10.
Example simultaneous spike and field recording 3. A: firing rate for condition 1 (solid) and condition 2 (dashed). B: mean LFP response for condition 1 (solid) and condition 2 (dashed). C: choice probability from ROC analysis applied to LFP (solid) and spike (dashed) AccLLR traces at each time bin following onset for conditions 1 and 2. D: single trial selection time curve for correct detection of spiking (circle), false alarm detection of spiking (square), correct detection of LFP activity (dot), and false alarm detection of LFP activity (cross). E: rasters of condition 1 spike activity for correctly detected trials (black). Rasters are sorted by selection time. Selection time calculated for each trial is marked (black rectangle). Rasters of condition 1 spike activity for missed and incorrectly detected trials (gray). F: waveforms of condition 1 LFP activity color-coded on a linear scale. Waveforms are sorted by selection time. Selection time calculated for each trial is marked (black rectangle). Waveforms of condition 1 LFP activity for missed and incorrectly detected trials are plotted above. G: average firing rate for correctly detected condition 1 trials aligned to selection time. H: mean LFP response for correctly detected condition 1 trials aligned to selection time; 95% CIs (shaded).

