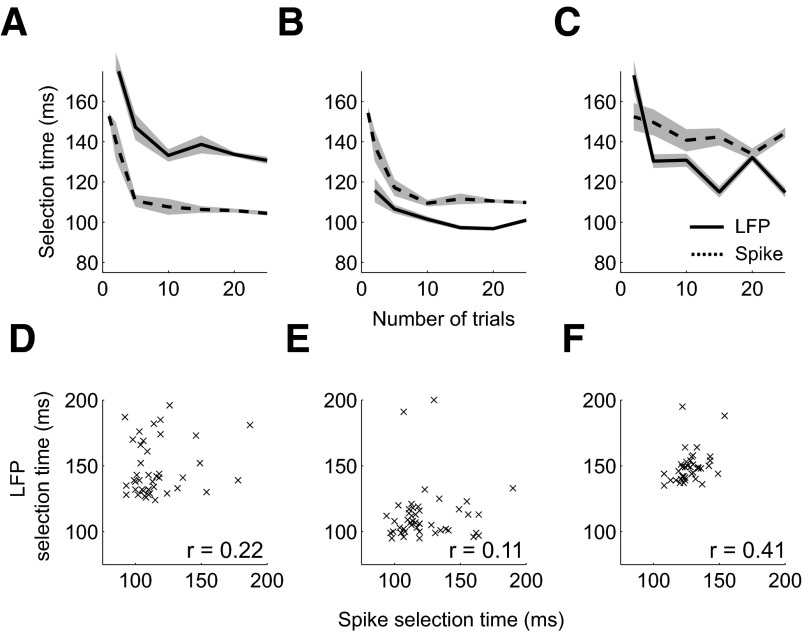
Fig. 12.
Comparison of spike and LFP activity in example spike and field recordings. A–C: mean selection time for spike (dashed) and LFP (solid) activity as number of trials in the average is varied from 1 to 25 trials. Results are shown when threshold detection level is set to give the greatest correct probability and fastest selection time and the false alarm probability is controlled to be 0. D–F: correlations between single trial selection times from simultaneously recorded spike activity and LFP activity for all correctly detected condition 1 trials. Spike-field selection times for each trial are shown by a cross. Spearman's rank correlation coefficient is shown in each panel. A and D: example spike and field recording 1. B and E: example spike and field recording 2. C and F: example spike and field recording 3.

