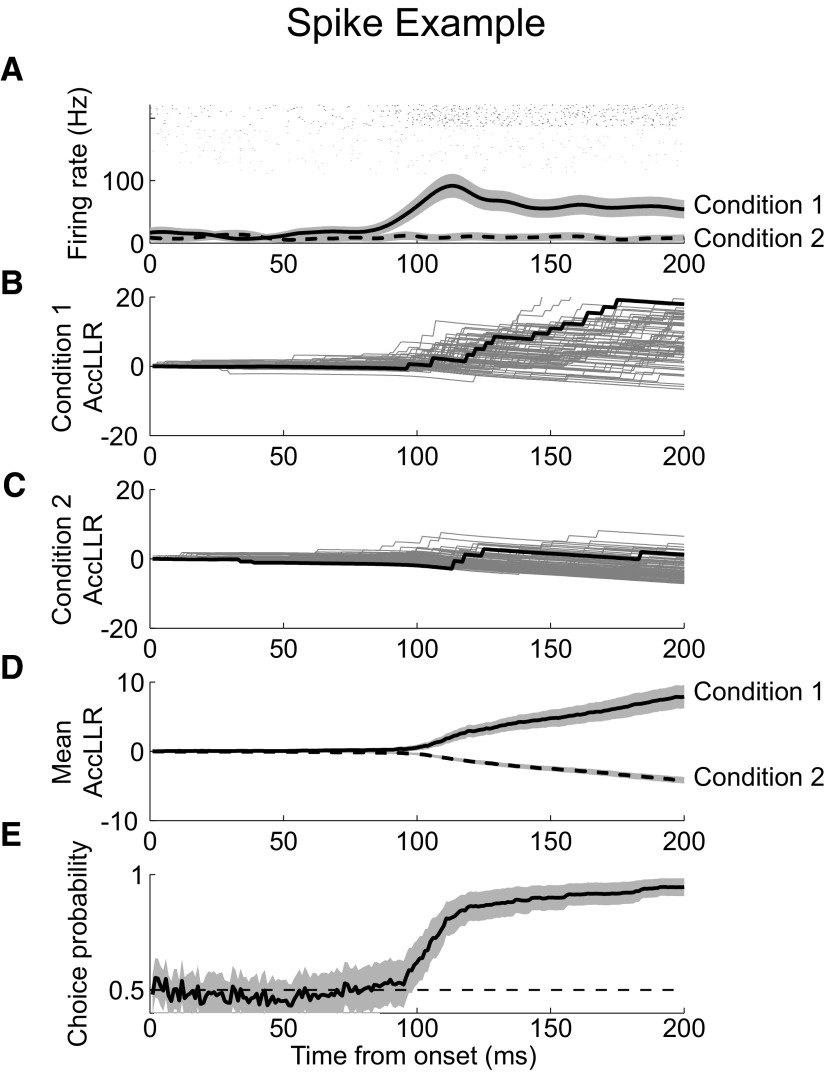
Fig. 2.
Example spike recording. A: firing rate for condition 1 (solid) and condition 2 (dashed). Rasters of spike activity during condition 1 (black) and condition 2 (gray). B: accumulated log-likelihood ratio (AccLLR) between conditions 1 and 2 for each trial during event condition. Sample trace highlighted for clarity (black). C: AccLLR for each trial during condition 1. Sample trace (black). D: mean AccLLR for trials during condition 1 (solid) and condition 2 (dashed). E: choice probability from receiver-operating characteristic (ROC) analysis applied to AccLLR traces at each time bin following onset for event condition and null condition; 95% confidence intervals (CIs) (shaded).

