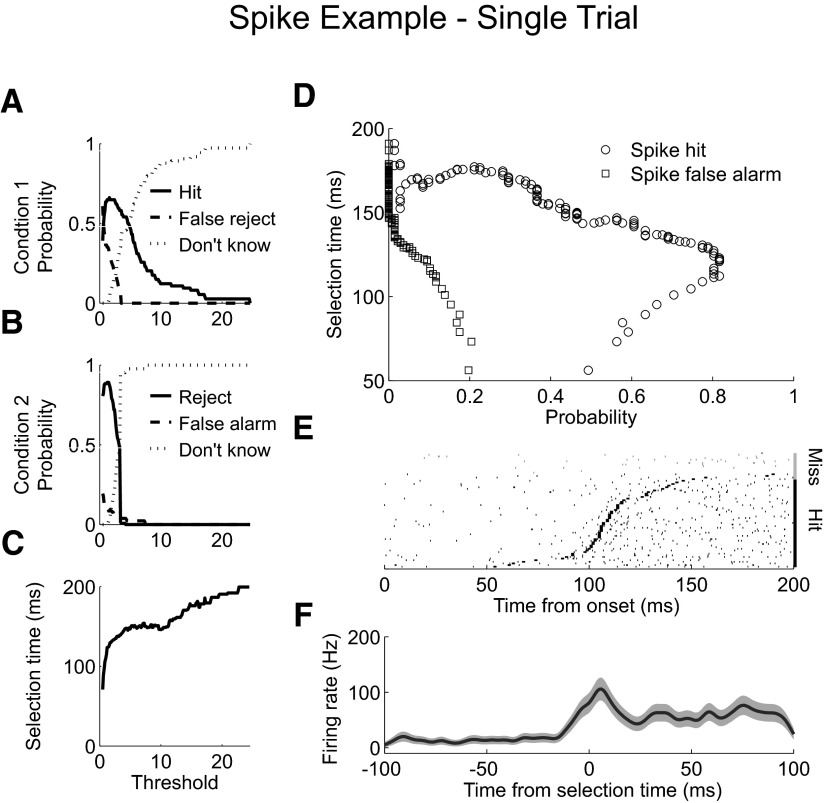
Fig. 3.
Spike example single trial analysis. A: probability of correctly detecting a single trial from condition 1, “hit” (solid). Probability of incorrectly classifying a condition 1 trial as being from condition 2, “false reject” (dashed). Probability of not classifying a condition 1 trial, “don't know” (dotted). Each probability is plotted as the level of the AccLLR detection threshold is varied from a low value to a maximum value. B: probability of correctly rejecting a single trial from condition 1 and assigning it to condition 2, “reject” (solid). Probability of incorrectly classifying a condition 2 trial as being from condition 1, “false alarm” (dashed). Probability of not classifying a null condition trial, “don't know” (dotted). Each probability is plotted as the threshold level is varied. C: mean selection time for correctly detected, “hit,” condition 1 trials as the threshold is varied. D: probability of correctly detecting a single trial from condition 1, “spike hit” plotted against the selection time as the level of the detection threshold is varied (circle). Probability for incorrectly detecting a trial from condition 2, “spike false alarm” (square). E: rasters of condition 1 spike activity for correctly detected trials (black). Rasters are sorted by selection time. Selection time calculated for each trial is marked (black rectangle). Rasters of condition 1 spike activity for missed and incorrectly detected trials (gray). F: average firing rate for correctly detected condition 1 trials aligned to selection time; 95% CI (shaded).

