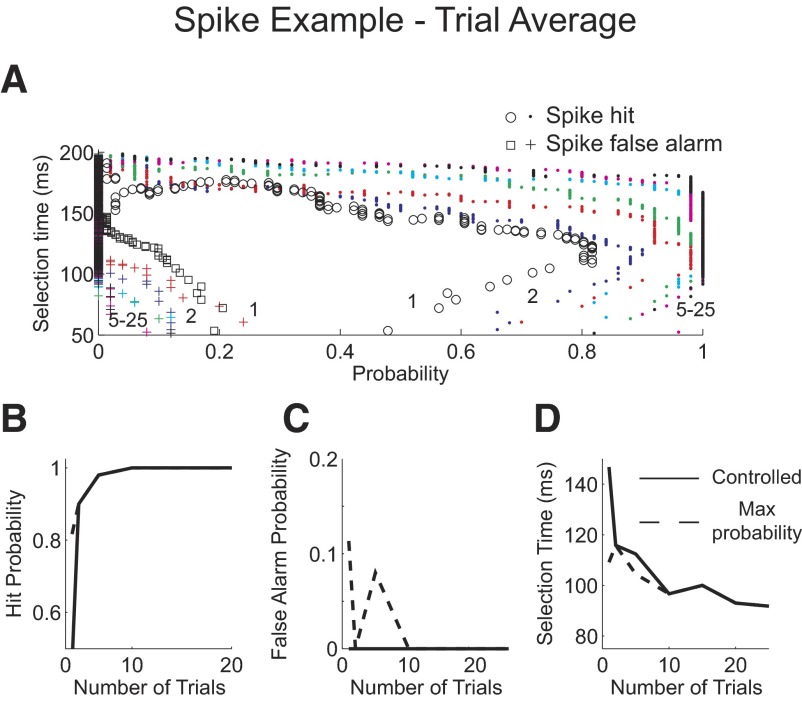
Fig. 4.
Spike example trial average analysis. A: probability of correctly detecting activity from one trial or from an average of 2, 5, 10, 15, 20, and 25 trials from condition 1, “spike hit” plotted against the selection time as the level of the AccLLR detection threshold level is varied from a low value to a maximum value (circle, dot). Probability for incorrectly detecting a trial from condition 2, “spike false alarm” (square, cross). Numbers within the panel denote number of trials in the average. B: probability of correctly detecting condition 1 activity as the number of trials in the average is varied. C: probability of a false alarm, detecting condition 2 activity, as the number of trials in the average is varied. D: mean selection time for correctly detected condition 1 trials as the number of trials in the average is varied. B–D: results when threshold detection level is set to give the greatest correct probability and fastest selection time when the false alarm probability is set to 0 (solid). Results when the threshold detection level is set to give the greatest correct probability (dashed).

