
Fig. 4.
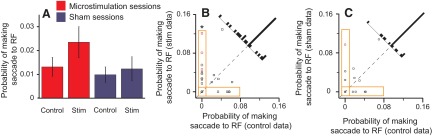
Probability of making a saccade to a previously fixated T inside the RF. A: the average (±SE) probability of making a saccade to the RF when there was a previously fixated T inside it in stimulation (stim) and control trials across stimulation (red) and sham sessions (blue). B and C: each point represents the probability of making a saccade to the RF from a single session when there was a previously fixated T inside the RF in stimulation trials (ordinate) compared with control trials (abscissa) in microstimulation (B) and sham (C) sessions. Histograms show the distribution of data points. Red points, single sessions with a significant difference between stimulation and control trials; circle symbol, monkey D; square, monkey E.