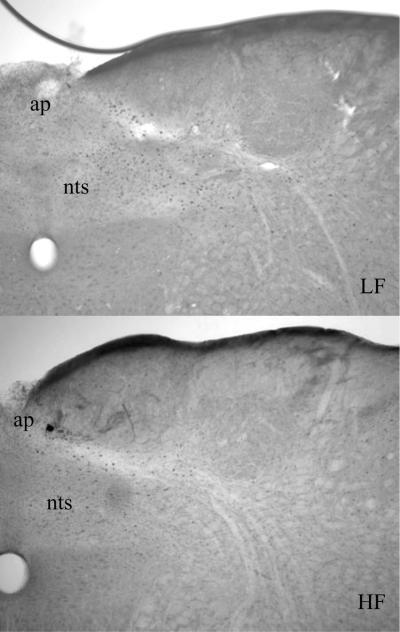
Figure 7b.
Sections of the NTS at the Area Postrema demonstrating c-fos immunoreactivity by DAB staining in rats gavaged with intralipid (1.5 mL) after 8 weeks on a LF or a HF diet, 90 min after gavage. The HF group shows a decrease in c-fos immunoreactivity compared to the LF group. ap= area postrema; nts= nucleus tractus solitarius.

