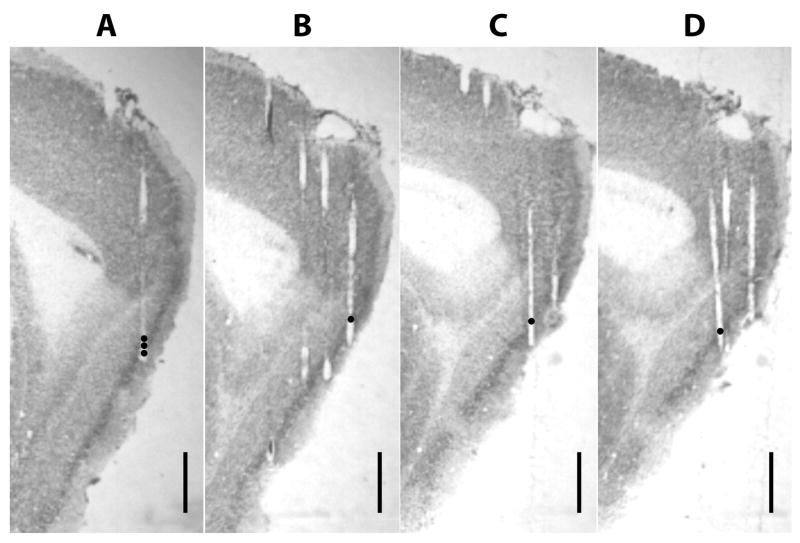
Figure 2. Representative tetrode tracks from MEC recordings (rat 191).
The dots indicate the recording sites where cells with boundary-related activity were recorded. (A) The three black filled circles indicate the progressively ventral recording locations of tetrode 17 on days 6, 7, and 8 (from the top), where cells 15, 16, 18, 19, 25, and 26 (see Fig. 4) were recorded. (B) Position of tetrode 18 on day 5, where cell 17 was recorded. (C) Position of tetrode 3 on day 3, where cell 24 was recorded. (D) Position of tetrode 1 on day 3, where cell 23 was recorded. Scale bar = 1 mm.

