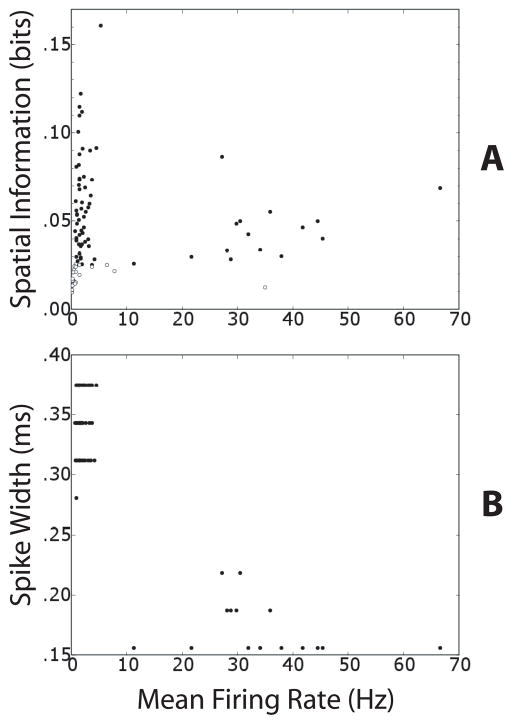
Figure 3. Spatial modulation of putative principal cells and interneurons.
(A) Scatter plot of mean firing rate (m.f.r.) and spatial information (SI) of all 93 cells. The m.f.r. refers to the epoch of the session that occurred in the entire large box after the removal of the small-box walls. Filled circles denote cells (n = 70) that had a SI greater than 3 times the maximum SI computed with 100 random shufflings of the cell’s spike train and the rat’s location (see Methods). Open circles denote the cells that did not pass this test and were excluded from the remapping analysis (n = 23). Note that the two populations are respectively above and below ~0.025 bits, even though the spurious information was estimated individually for each cell. (B) Scatter plot of the m.f.r. and spike width of the 70 cells that are represented by filled circles in A. Two distinct clusters represent putative principal cells (m.f.r. < 10 Hz) and putative interneurons (m.f.r. >10 Hz).

