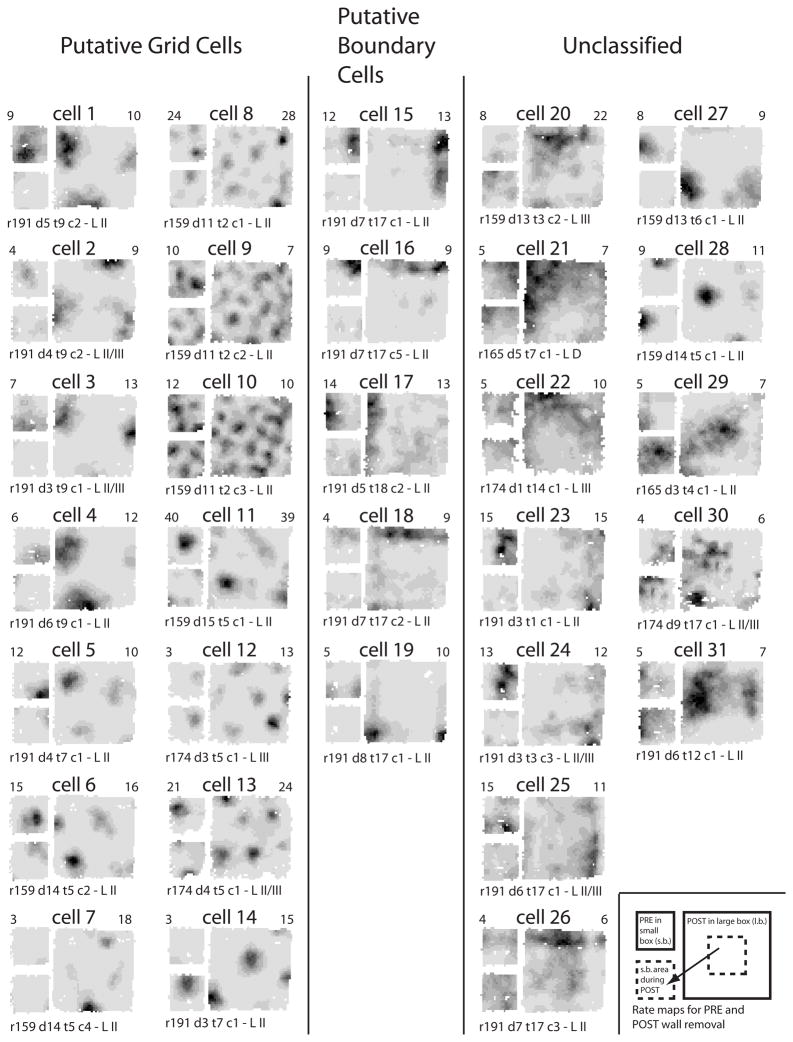
Figure 4. Firing rate maps of all putative principal cells (m.f.r. < 10 Hz) with SI > 0.05 bits (see Fig. 3).
For each cell, the small map at upper left represents the small box session before the walls were removed (PRE epoch). The large map represents the large-box session after the small-box walls were removed (POST epoch). The small map at the lower left is derived from the large map by including only the pixels covered during the PRE epoch. The same grayscale is shared by all three rate maps of each cell: white denotes unvisited bins, darker shades of gray represent higher firing rates, and black is the highest of the PRE and POST peak rates (top left and right numbers respectively). Recording information is at the bottom: rat (r), day (d), tetrode (t), unit (c), and MEC layer (L II/III means a precise determination was not possible and L D denotes deep layers). Note that most of the cells shifted their fields in the small-box area after the removal of its delimiting walls.

