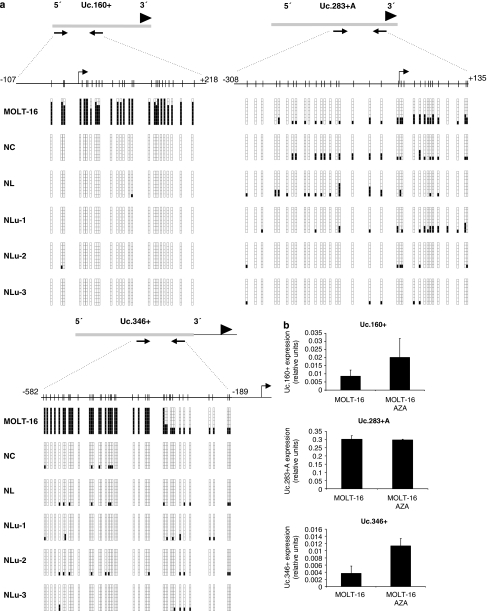
Figure 4.
CpG island methylation and expression of T-UCRs in cancer cell lines and normal tissues. (a) Bisulfite genomic sequencing of the associated CpG islands for the T-UCRs Uc.160+, Uc.283+A and Uc.346+ in the leukemia cell line MOLT16 and normal tissues (colon, NC; lymphocytes, NL; lung, Nlu-1 to Nlu-3). CpG dinucleotides are represented as short vertical lines and the location of the T-UCR probe from the expression microarray is represented as a black arrowhead. The locations of the bisulfite genomic sequencing primers are indicated by black arrows. Eight single clones are represented for each sample. Presence of a methylated or unmethylated cytosine is indicated by a black or white square, respectively. The transcription start sites identified by RACE are represented by vertical black arrows. (b) Expression analyses of T-UCRs by quantitative RT–PCR. Uc.160+ and Uc.346+ show minimal expression in the hypermethylated MOLT-16 cells, while treatment with the DNA-demethylating agent 5-aza-2′-deoxycytidine (AZA) induces T-UCR upregulation. The Uc.283+A CpG island is unmethylated in MOLT-16 and the T-UCR is expressed at similar levels in the untreated and demethylating agent-treated cells.

