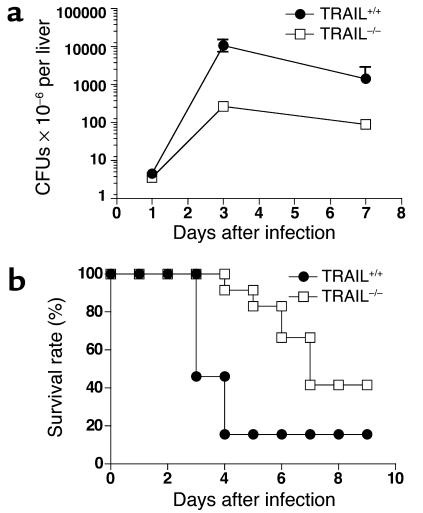
Figure 7.
L. monocytogenes counts in the liver and mouse survival rates. (a) Two groups of BALB/c mice (n = 5) were treated as described in the legend to Figure 6 and sacrificed 1, 3, and 7 days after Listeria infection. The total number of bacteria in the liver and spleen was determined as described in Methods. Results shown are from one representative experiment of four. The differences between the two groups are statistically significant for days 3 and 7 as determined by ANOVA (P < 0.0001). (b) TRAIL+/+ (n = 13) and TRAIL–/– (n = 12) BALB/c mice were infected with 5 × 10⁴ CFUs of L. monocytogenes as described in the legend to Figure 6. Data shown are survival rates of TRAIL+/+ and TRAIL–/– mice pooled from four independent experiments. The difference between the two groups is statistically significant as determined by Mann-Whitney test (P < 0.01).

