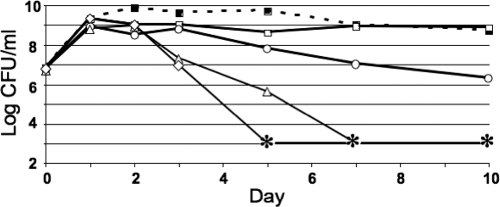
FIG. 1.
Glucose toxicity profile. Cells were inoculated with the indicated amounts of glucose added: 0.2% (open squares), 0.4% (open circles), 0.6% (open triangles), and 0.8% (open diamonds). The dashed line with filled squares represents LB medium without glucose. Asterisks indicate titers below the limit of detection of <1,000 CFU/ml; titering error was ±2- to 3-fold (28). Representative data are shown (n = 3).

