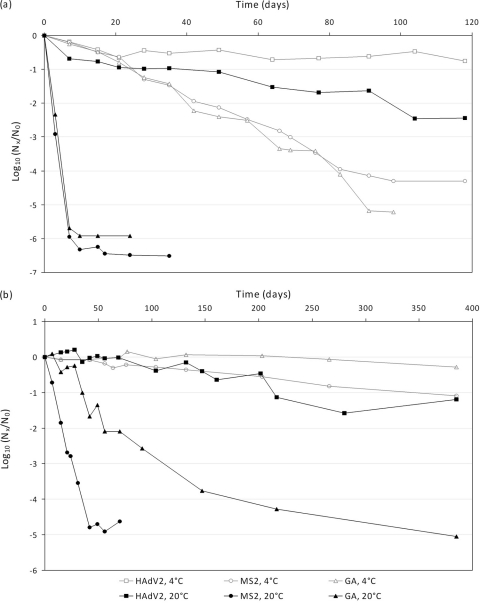
FIG. 1.
Decay of virus concentration [log10 (Nx/N0)] as determined by infectivity assays (a) and real-time PCR (b) at 4°C and 20°C in groundwater microcosms. In the infectivity assay, Nx and N0 are expressed in PFU/ml for phages or MPNCU/ml for adenovirus. In the molecular assay, decay was calculated using the threshold cycle (CT) values and the slope of the standard curve: log10 (Nx/N0) = (CT0 − CTx)/slope. The value corresponding to each time point is the geometric mean of two independent replicates (n = 2).

