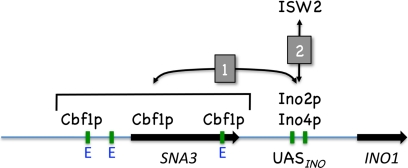
Fig. 9.
Model for regulation of INO1 transcription by Ino2p-Ino4p, Cbf1p, and ISW2. Black arrows indicate the positions of genes, and green bars indicate the positions of UASINO elements and other potential E boxes. Numbered arrows indicate the sequence of events. Refer to Discussion for a complete description of the model.

