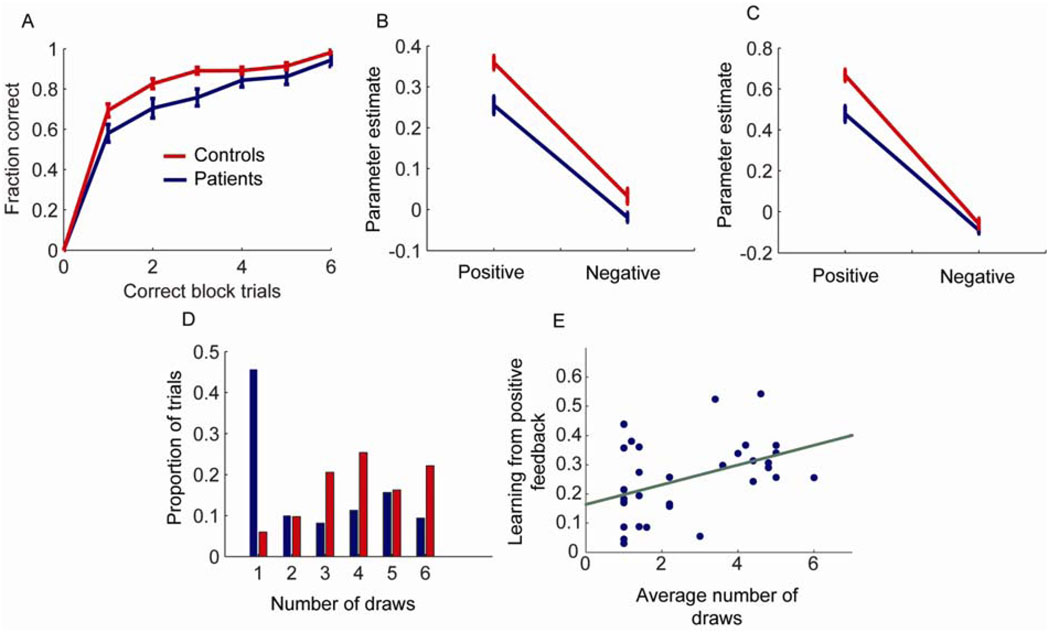
Fig. 2.
Behavioral and modeling results. A. Fraction of correct trials as a function of the number of correct trials per block. Zero correct trials will always have zero correct by definition. B. Parameter estimates for data fit to entire block of trials for patients and controls showing how much was learned from positive and negative feedback. C. Parameter estimates for data fit to entire block of trials with discounting of old evidence. This analysis emphasizes response to feedback at the end of the block. Note, the overall increase in the parameter values reflects the discount parameter, so they cannot be directly compared to the results in (B). D. Number of draws to decision in the urn task for controls and patients. E. Correlation between average number of draws to decision in patients and learning from positive feedback. Green line shows least squares fit.

