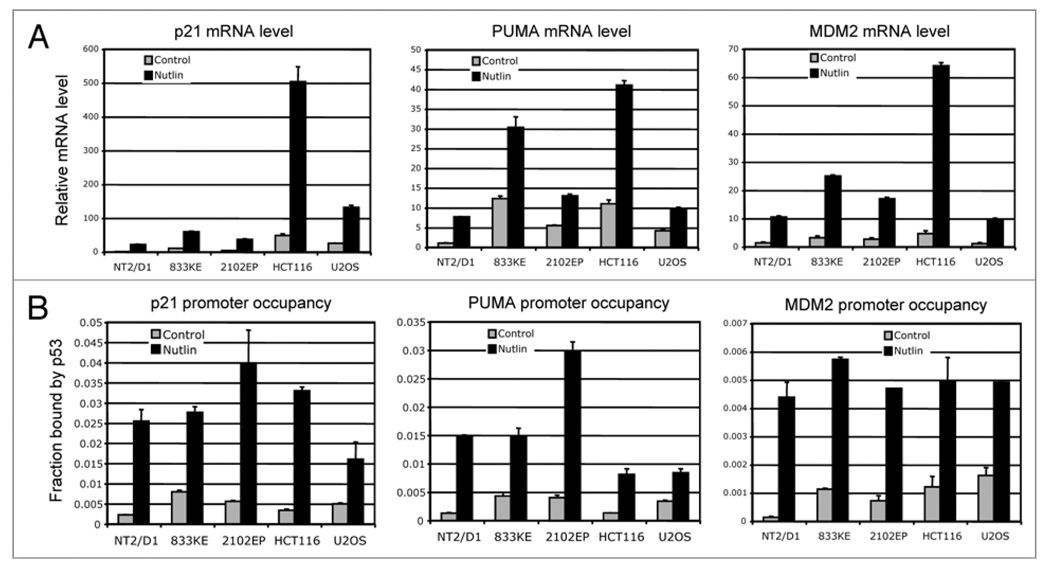
Figure 7.
Cell type-specific variation of p21 response to p53. (A) Cells were treated with 5 µM Nutlin for 18 hrs and the mRNA levels of p53 target genes p21, PUMA and MDM2 were determined by quantitative RT-PCR and normalized to actin mRNA level. (B) Cells were treated with 5 µM Nutlin for 18 hrs and analyzed for p53 binding to p21, PUMA and MDM2 promoters by ChIP. Diluted input chromatin from each cell line was used during qPCR to help determine the percent of promoter DNA that were coprecipitated with p53 antibody (promoter occupancy).

