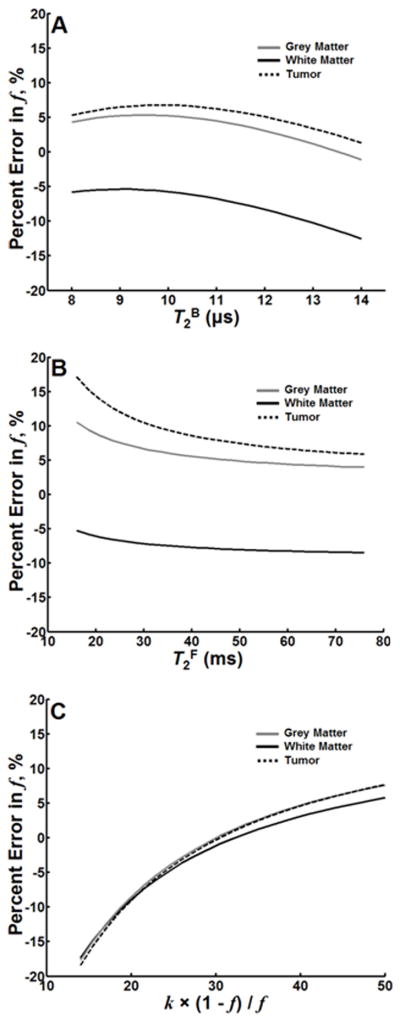
Figure 6.
Relative error in f across serial values of T2B (A), T2F (B), and k(1−f)/f (C) for GM, WM and a tumor. Relative error was calculated as the difference between output of the one-parameter fit performed on simulated data and the initial value of f (used to simulate the Z-spectra) normalized to the initial value of f.

