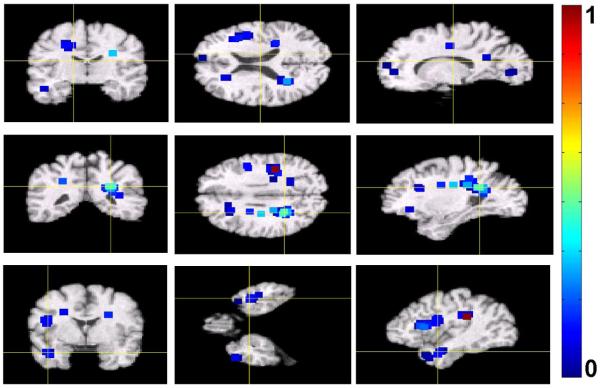
Figure 14.
Example of 102 top-ranked detected locations signifying differences between cognitively stable and cognitively declined subjects in the BLSA study. The neigbourhoods of the detected locations are colorcoded with respect to their relevance for clustering. For display purposes, the values of clustering relevance for the top 102 locations where normalized to be within the unit interval. Higher values of the color map indicate higher relevance.

