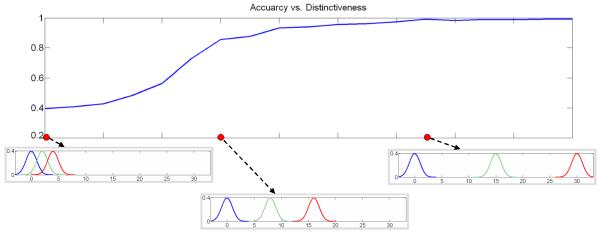
Figure 6.
Evolution of clustering accuracy with atrophy distinctiveness. The horizontal axis represents difference between thinning parameter distributions. Thinning parameter distributions for some experiments are also shown. Intuitively, highly overlapping distributions indicate absence of distinct clusters in the dataset.

