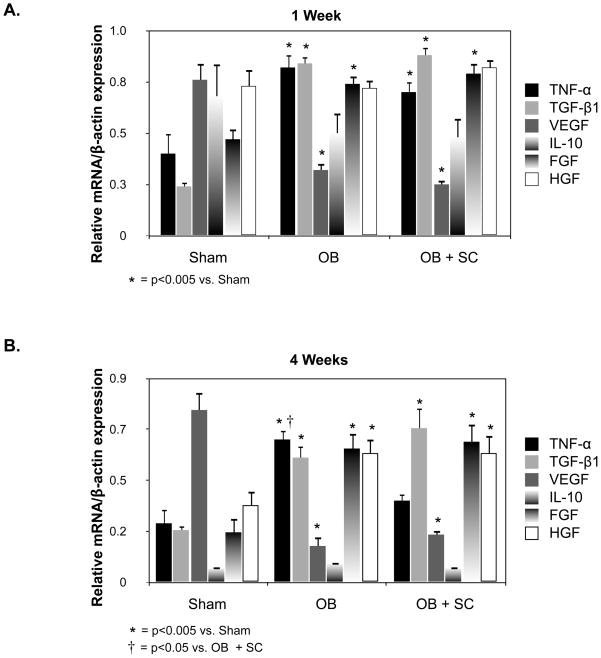
Figure 6. Renal cortical cytokine and growth factor gene expression following UUO.
A. Quantitative renal cortical TNF-α, TGF-β1, VEGF, IL-10, FGF, and HGF mRNA expression represented as a percentage of β-actin in animals exposed to sham operation (Sham) or 1-week of UUO in the presence of vehicle (OB) or exogenous MSC (OB + SC). B. Quantitative renal cortical TNF-α, TGF-β1, VEGF, IL-10, FGF, and HGF mRNA expression represented as a percentage of β-actin in animals exposed to sham operation (Sham) or 4 weeks of UUO in the presence of vehicle (OB) or exogenous MSC (OB + SC).

