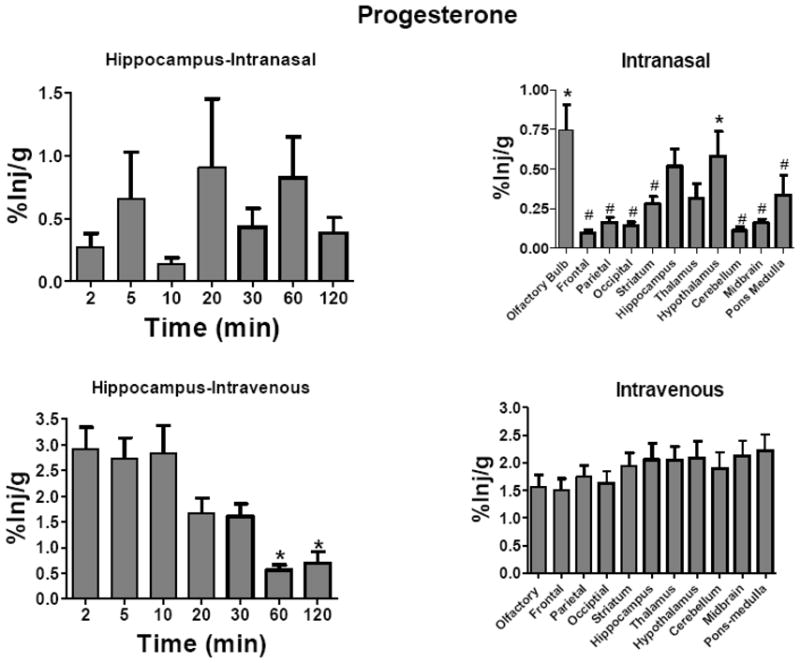
Fig. 3.

Uptake Over Time and Brain Distribution of 3H-Progesterone After Intravenous or Intranasal Administration. Results are expressed as the percent of the administered dose present per g of brain region (%Inj/g). Letters indicate groups that are not statistically different from one another. Upper left panel shows hippocampus as a representative brain region for uptake of H-Prog after its intranasal administration. Neither the hippocampus nor any other brain region showed a time-dependent change in %Inj/g after intranasal administration (n = 5/time point). Brain regions, however, showed statistically significant differences after intranasal administration (upper right panel; n =35/region, * = different from frontal cortex, parietal cortex, occipital cortex, cerebellum, and midbrain, # = different from olfactory bulb and hypothalamus). Lower left panel shows hippocampus as a representative brain region after the intravenous administration of H-Prog. Earlier time points (2–10 min) were higher than later time points (n = 5 time point). Brain regions, however, showed no statistical differences after intravenous administration (lower right panel, n = 35/region). Means are shown with their S.E.M.
