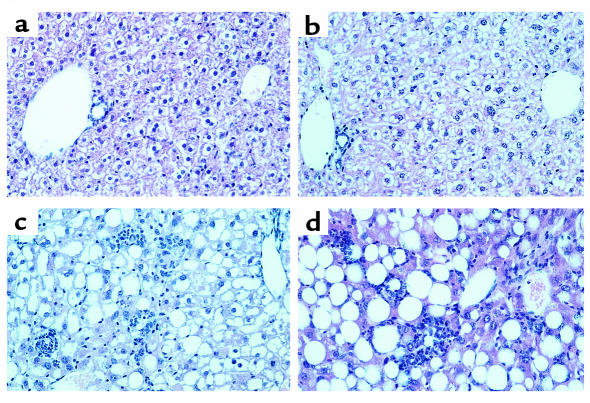
Figure 3.
Liver sections from Cyp2e1+/– mice and Cyp2e1–/– mice fed the MCD diet or the control diet for 10 weeks. (a) Cyp2e1+/– mouse and (b) Cyp2e1–/– mouse fed the control diet. The appearance of the hepatic parenchyma is similar in both genotypes. (c) Cyp2e1+/– mouse and (d) Cyp2e1–/– mouse fed the MCD diet. Administration of the MCD diet to both genotypes produced a severe macrovesicular, panlobular steatosis, hepatic necrosis, and mixed inflammatory infiltrate. H&E staining; ×160.

