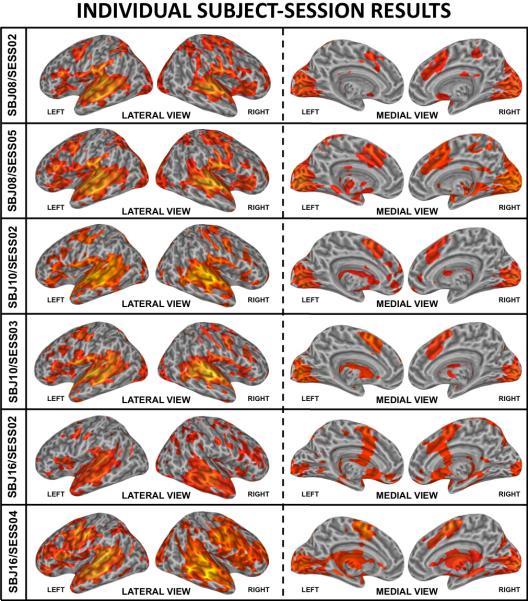
FIGURE 6.
Selected individual subject-level/single-session (individual Subject-Session) activation maps at pFDR<0.005. First and second rows correspond to subject Sbj08 (sessions 2 and 5 respectively). Third and fourth rows correspond to subject Sbj10 (sessions 2 and 3 respectively). Fifth and sixth rows correspond to Sbj16 (sessions 2 and 4 respectively).

