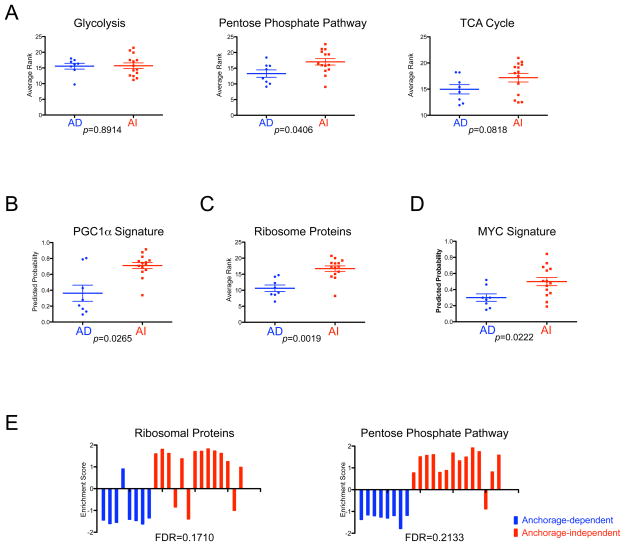
Figure 3. Characterization of the anchorage-independent growth expression signatures.
A. Comparison of the patterns of gene sets that reflect glucose metabolism between breast cancer cells with anchorage-dependent (AD<20 colonies) and anchorage-independent (AI>500 colonies) growth ability. Based on the gene list in previous work (Funes et al., 2007), we make the average rank of the gene sets for glucose metabolism pathways to estimate the activity of the pathway. Relative expression in the form of average rank is plotted and compared between breast cancer cells with AD and AI growth ability by Mann-Whitney U test using GraphPad’s Prism. A bar indicates the mean value for each group.
B. Prediction of the peroxisome proliferator-activated receptor-gamma co-activator 1 α (PGC1α) activity in breast cells. The predicted probabilities of PGC1α are plotted and compared between breast cancer cells with anchorage-dependent (AD<20 colonies) and anchorage-independent (AI>500 colonies) growth ability by Mann-Whitney U test using GraphPad’s Prism. A bar indicates the mean value for each group.
C. Comparison of ribosomal protein expression between breast cancer cells with anchorage-dependent (AD<20 colonies) and anchorage-independent (AI>500 colonies) growth ability. Based on gene symbols from Affymetrix, we compute the average rank of the ribosomal genes to estimate a state of ribosomal biogenesis. Relative expression in the form of average rank is plotted and compared between breast cancer cells with AD and AI growth ability by Mann-Whitney U test using GraphPad’s Prism. A bar indicates the mean value for each group.
D. Prediction of the MYC activity in breast cells. The predicted probabilities of MYC are plotted and compared between breast cancer cells with anchorage-dependent (AD<20 colonies) and anchorage-independent (AI>500 colonies) growth ability by Mann-Whitney U test using GraphPad’s Prism. A bar indicates the mean value for each group.
E. Gene Set Enrichment Analysis (GSEA) of anchorage-independent growth ability. GSEA revealed enrichment of ribosomal proteins and pentose phosphate pathway with statistical significance (false discovery rate: FDR<0.25). Enrichment score for each sample is further calculated by ASSESS (analysis of sample set enrichment scores) and plotted as bar graphs.

