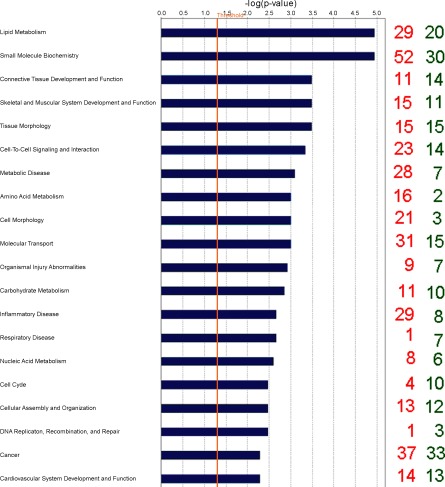
Fig. 1.
Classification of differentially expressed genes (DEG) according to top 20 molecular and cellular functions, most significantly affected by energy balance (EB) using Ingenuity Pathways Analysis. The blue bars indicate the likelihood [−log (P-value)] that the specific molecular and cellular function category was affected by negative energy balance compared with others represented in the list of DEG. The number of up- and downregulated genes in each group is represented on the righthand side by red and green numbers, respectively. The cut-off (yellow line) is shown at P < 0.05 (1.301 log scale).

