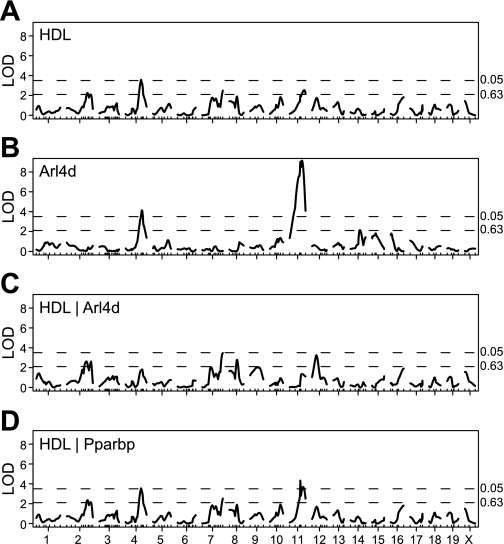
Fig. 2.
Genome scans. We scanned the genome for quantitative trait loci (QTL) in the B6 × D2 cross at a 2 cM resolution. Four scans are shown: HDL cholesterol with no covariates (A), Arl4d transcript with no covariates (B), HDL with Arl4d transcript as a covariate (C), and HDL with Pparbp transcript as a covariate (D). Dotted lines indicate significant (P = 0.05) and suggestive (P = 0.63) thresholds based on 1,000 permutations. Transcript data were transformed using van der Waerden scores (17). LOD, logarithm of the odds.

