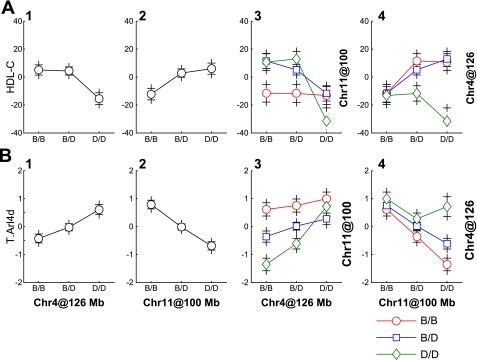
Fig. 3.
Epistatic interactions. The interaction effects between QTL on chromosomes 4 and 11 for HDL levels (A) and the Arl4d transcript (B) are shown. Columns 1 and 2 show the main effects for QTL on chromosomes 4 and 11, respectively. Column 3 shows their joint effects with chromosome 4 genotypes on the x-axis and chromosome 11 genotypes indicated by grouping of points (BB, red; BD, blue; and DD, green). Column 4 shows the same joint effects with the roles of chromosomes 4 and 11 reversed. The transcript levels were transformed using van der Waerden scores (17). Values are shown as means ± SE. The HDL levels are expressed as deviations from the population mean value of 0.

