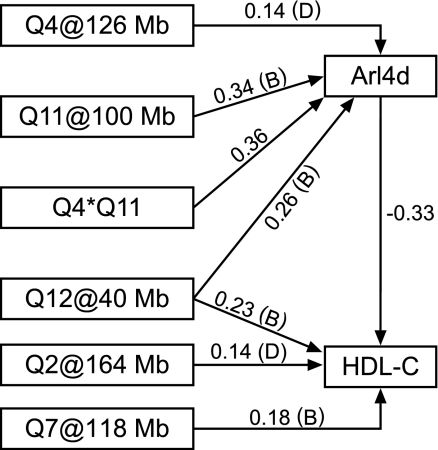
Fig. 4.
Structural equation model. The best-fitting structural equation model relating HDL cholesterol and the Arl4d transcript is shown. Genetic loci, indicated as Q(chromosome)@(position), are treated as additive effects in the regression. The interaction term (Q4*Q11) is also additive-by-additive. Connecting edges in the graph are directed indicating the hypothesized causal structure of the model. Numerical edge labels are standardized path coefficients indicating the relative magnitude of the regression coefficients. Parenthetic labels indicate the high allele for genetic effects.

