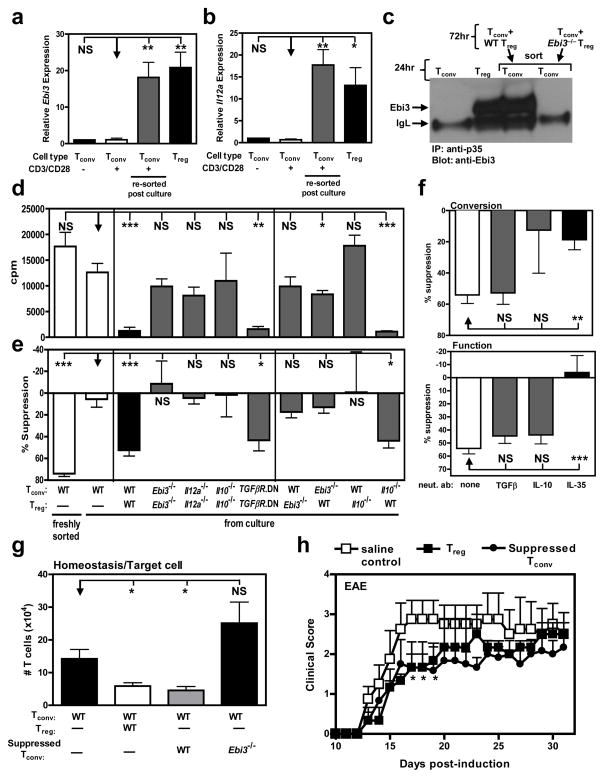
Figure 5. Tregs generate iTR35 in an IL-35- and IL-10-dependent manner.
Tconv were activated in the presence of Treg at a 4:1 ratio (responder: suppressor) for 72 h. (a) RNA was extracted and cDNA generated from resting or activated Tconv cells or from Tconv:Treg co-cultures (resorted based on differential Thy1 markers). Ebi3 (a) and Il12a (b) expression of the populations indicated. (c) Following co-culture, suppressed Tconv were re-purified and cultured for an additional 24 h. Secretion of IL-35 was determined by IP/WB of culture supernatants and compared to that of freshly cultured Tconv and Treg. (d) Following co-culture, suppressed Tconv were re-purified and activated (αCD3/CD28). Proliferative capacity was assayed by [3H]-thymidine incorporation. (e) The suppressive capacity of suppressed Tconv upon fresh responder Tconv cells was determined by [3H]-thymidine incorporation. (f) Anti-IL-10, anti-TGFβ, or anti-IL-35 neutralizing antibodies were added to co-cultures to inhibit cytokine driven “conversion” into suppressed Tconv (top panel) or added in secondary proliferation assays to inhibit cytokine driven suppression of “function” (bottom panel). (g) Tconv cells alone or with C57BL/6, Ebi3−/− suppressed Tconv (as regulatory cells) were injected into Rag1−/− mice. Seven days after transfer, splenic T cell numbers were determined by flow cytometry. (h) EAE was induced by immunizing mice with MOG35–55 peptide in complete Freund’s adjuvant followed by pertussis toxin administration. 1 × 10⁶ suppressed Tconv or natural Treg were transferred i.v. into C57BL/6 mice 12–18 hours prior to disease induction. Clinical disease was monitored daily. Clinical score was statistically significant between mice receiving saline control and Treg or suppressed Tconv at days 16–18. Counts per minute of Tconv cells activated alone were 14,000–34,000 (e, f). Data represent the mean ± SEM of 8–12 mice per group from at least 2 independent experiments [* p < 0.05, ** p < 0.005, *** p < 0.001, NS = not significant].

